.webp)
During my time at MSD, I embarked on a cool project – building the data enrichment platform! I had the opportunity of representing data in multiple views and handling different data types in the UI. This case study is a culmination of my learnings working on the project. The designs you'll see are revamped versions of the screens I crafted at MSD. Sadly, I can't show you the exact screens due to NDA stuff, but I've jazzed up the designs a bit for some extra flair!
Vue.ai prioritizes enhancing data quality and organization, utilizing machine learning tools to efficiently structure and label product data. The company offers services such as product tagging, catalog visualization, document data extraction, and content enrichment. Vue.ai also provides AI-driven business intelligence models for insights and predictions, empowering teams to develop their own ML applications.
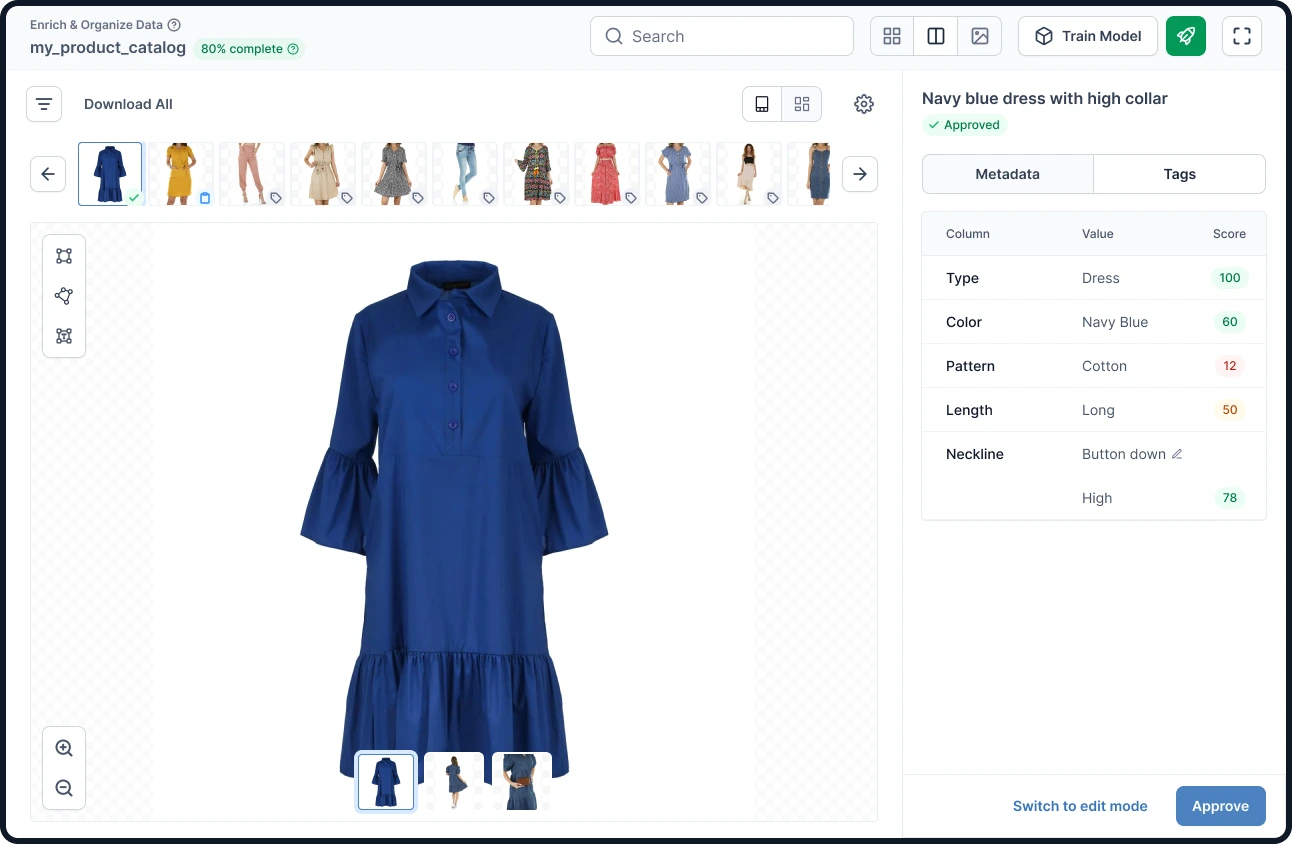
The product focuses on enhancing and organizing data. Users can use a preset or build their own custom classification model to predict data from image or text. Users build a taxonomy, tag some products, and train the system. The model then auto tags the rest of the products. QA analysts play a key role by fixing any wrong predictions, improving the model. The trained models and custom taxonomy can be easily exported to fit into existing systems.
Its an AI led model engine that empowers you to build your own custom models, that progressively & automatically enriches your data for you. - Vue.ai

User feedback highlighted two main issues.
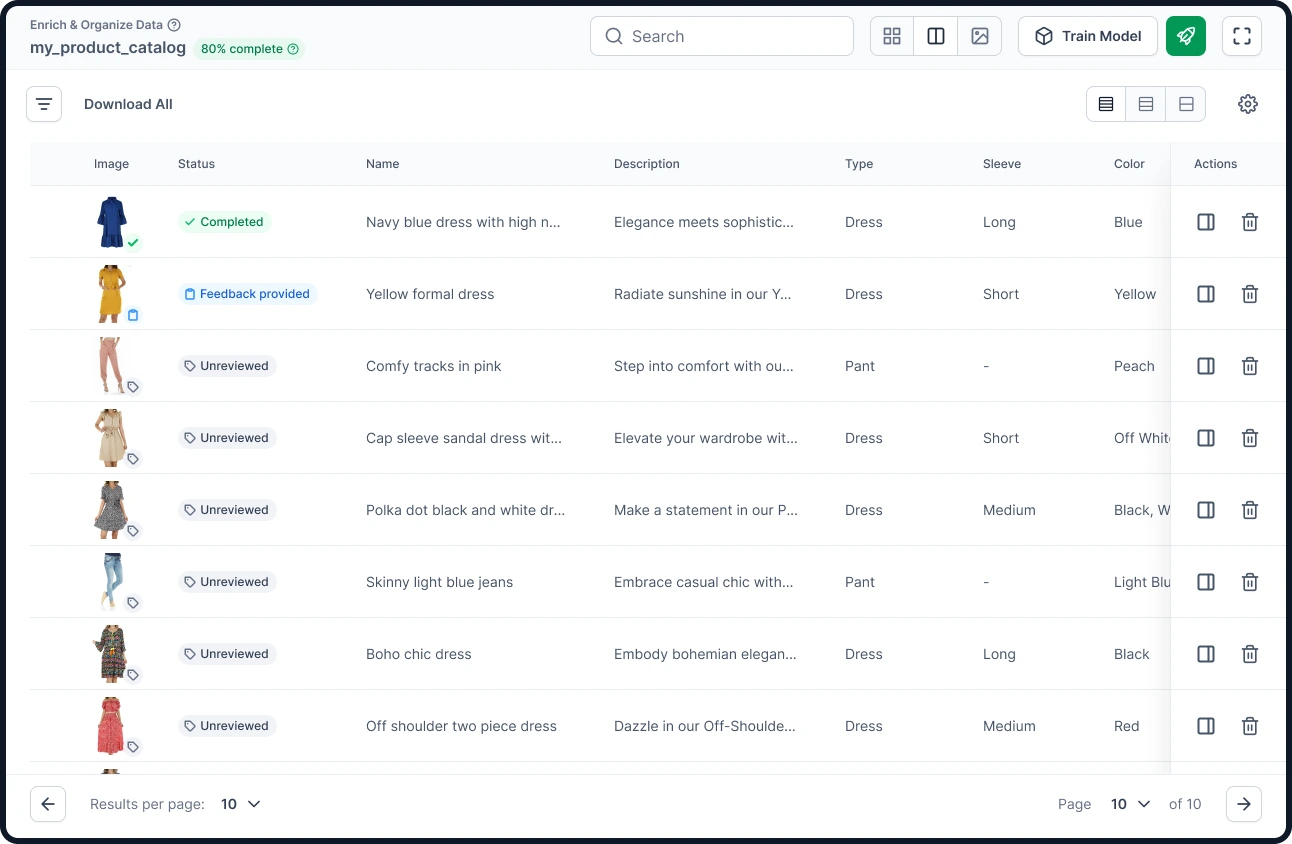
Currently, users have two methods for data enrichment. The cluster view groups products based on similarity to a target attribute value, while the bulk edit view allows users to tag multiple products for an attribute. However, in both cases, users can't classify across different levels of the taxonomy, meaning they can't assign multiple attribute-value pairs at the same time. The time taken to tag products is high.
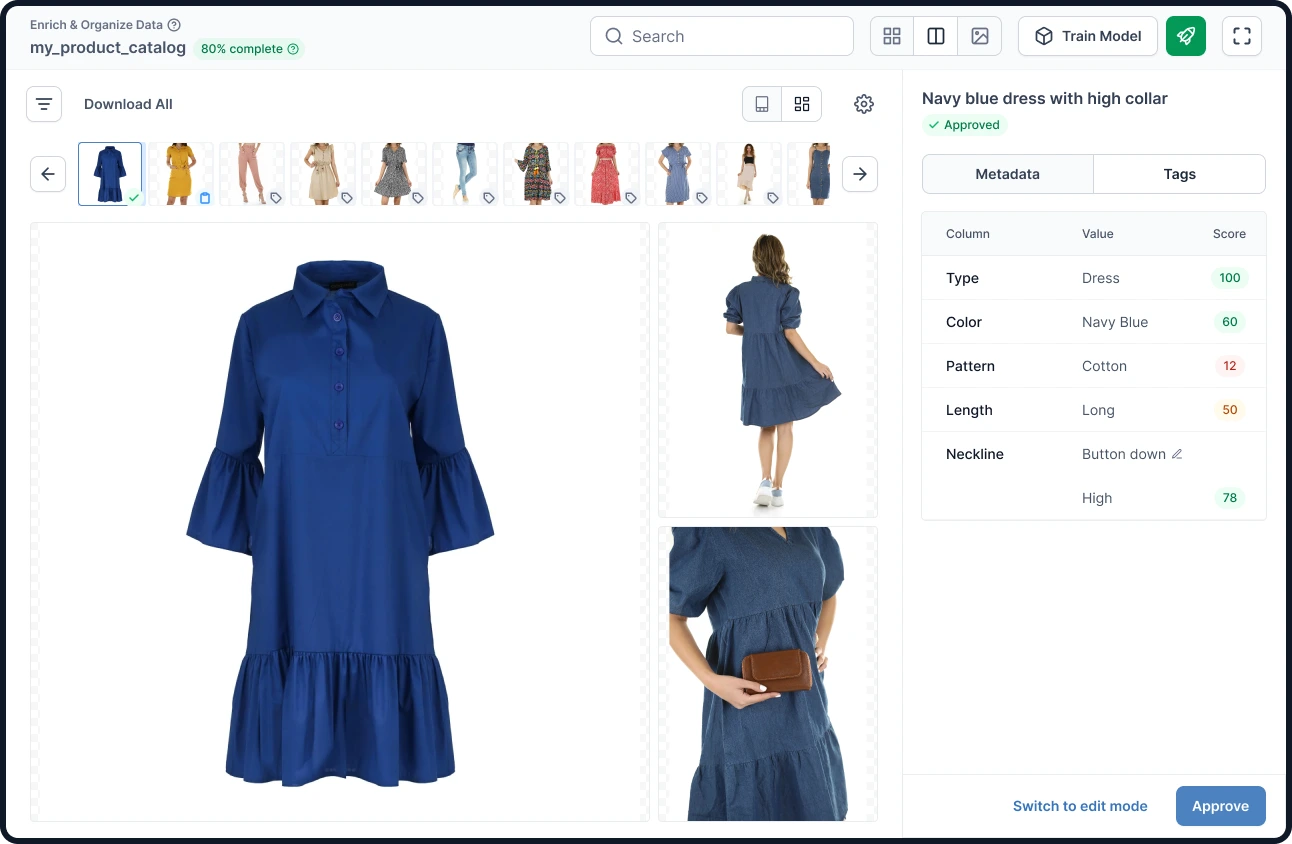
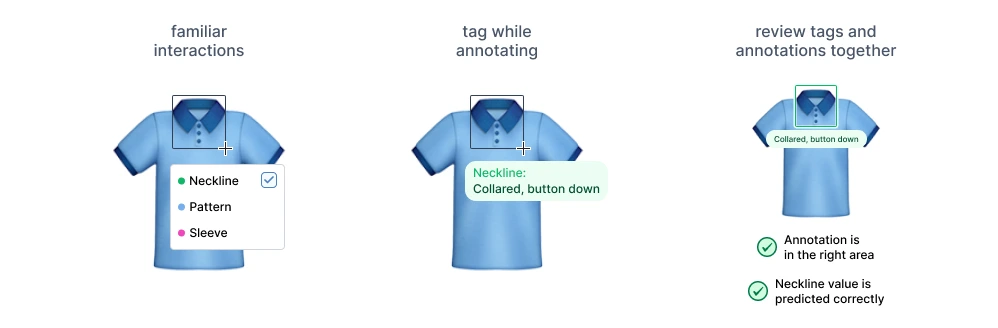
There's no way for users to focus a search on a specific image area for attributes. For instance, finding a detailed attribute like 'neckline closure type' through prediction would be more efficient if the model could narrow its search to just the neckline area of the image.

The project is tied to the QA analysis platform since there's a lot of overlap in features for data enrichment. The designs need to work smoothly for both platforms and should be flexible enough to handle different data types like images, documents, and text.
💡 Ensuring compatibility and integration between the two platforms is essential for a seamless and effective user experience.
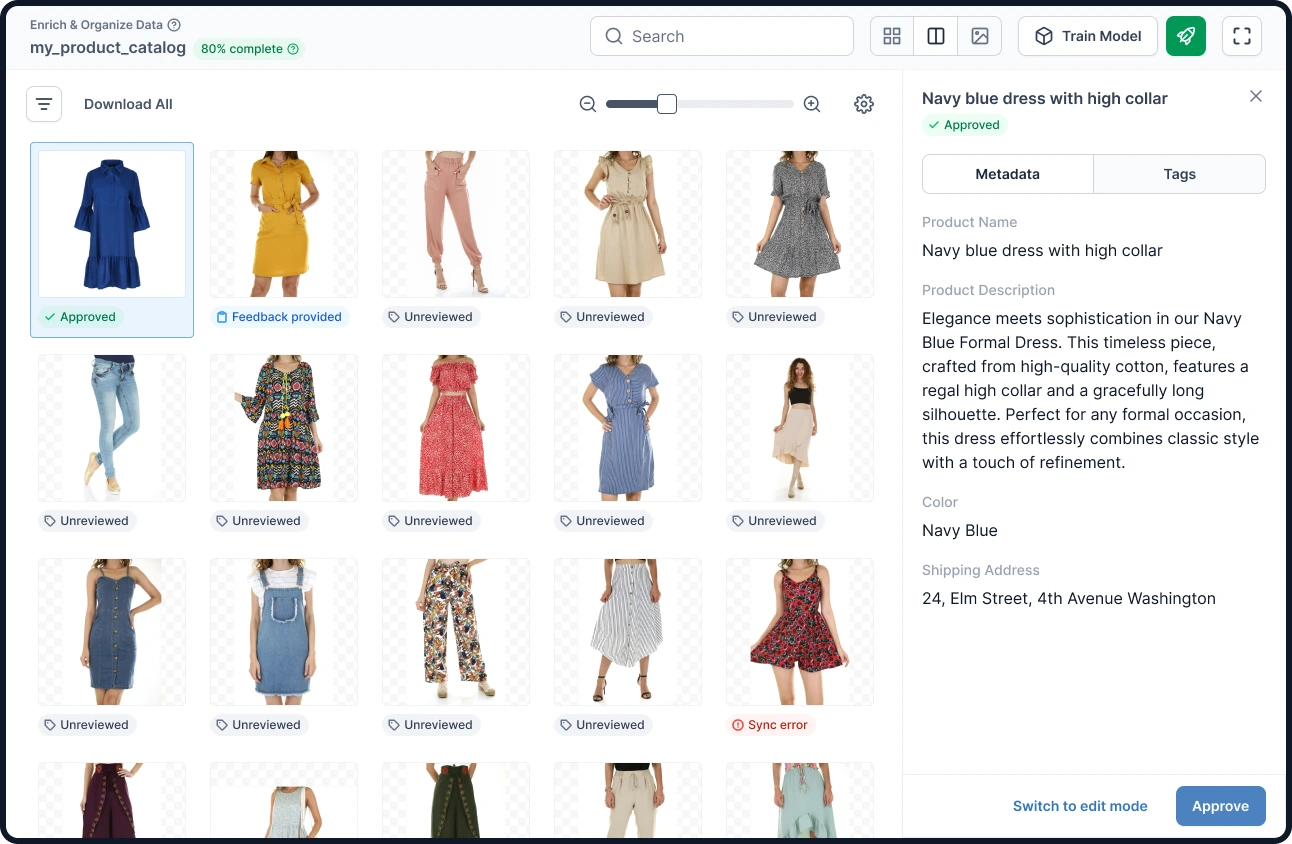
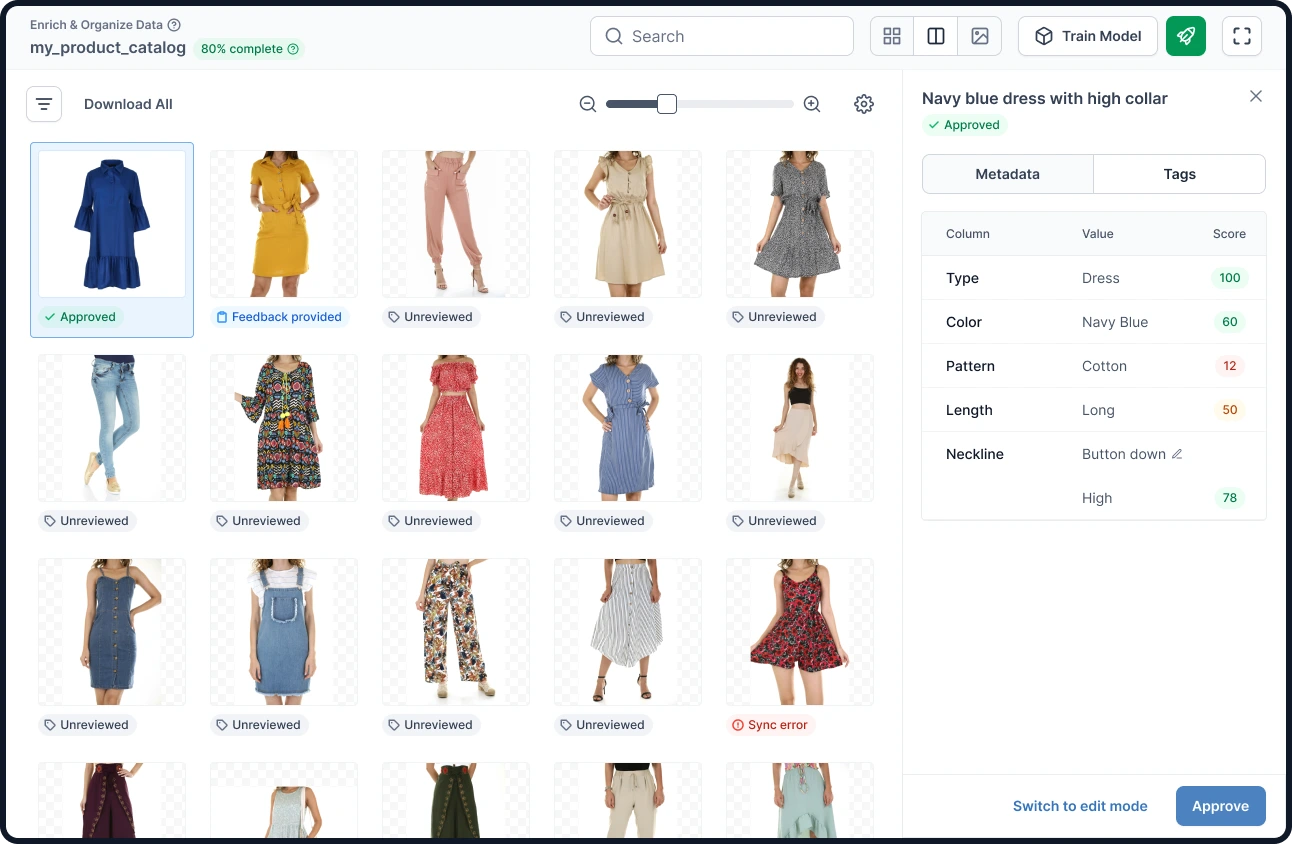
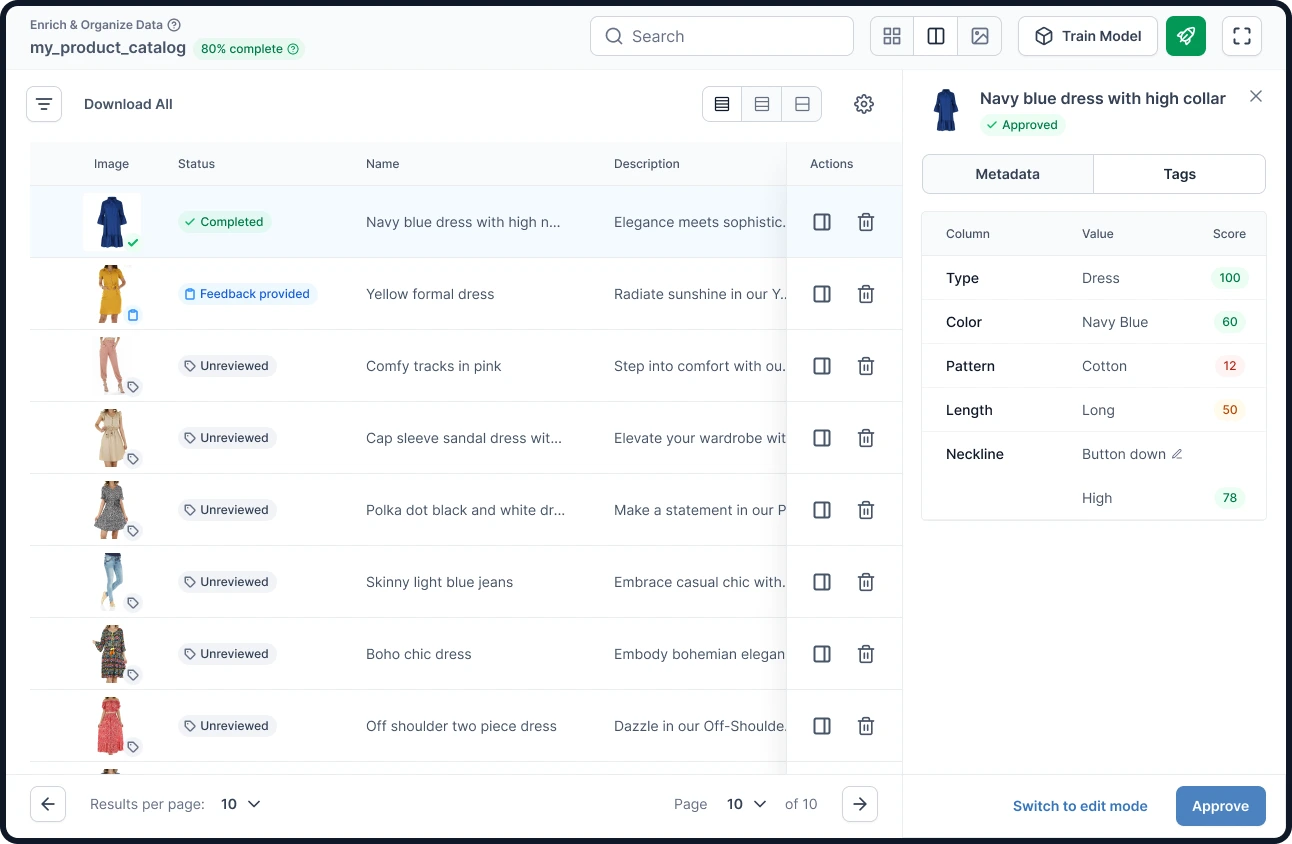
In designing this project, we opted to reuse components and build upon existing ones. We focused on surfacing more metrics and made a conscious decision to steer away from using popups. This approach aims to enhance user experience by leveraging familiar elements and providing clearer insights without the disruption of pop-up interfaces.
The solution for localizing search for an attribute on an image involved using annotations. Throughout multiple iterations, the following key design decisions were made:
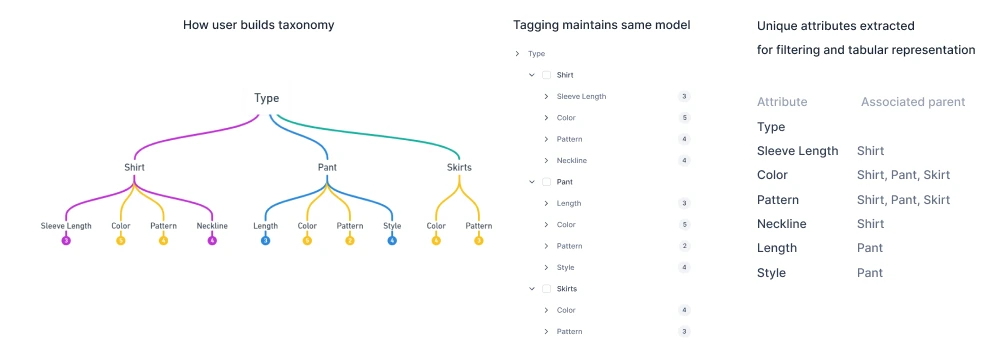
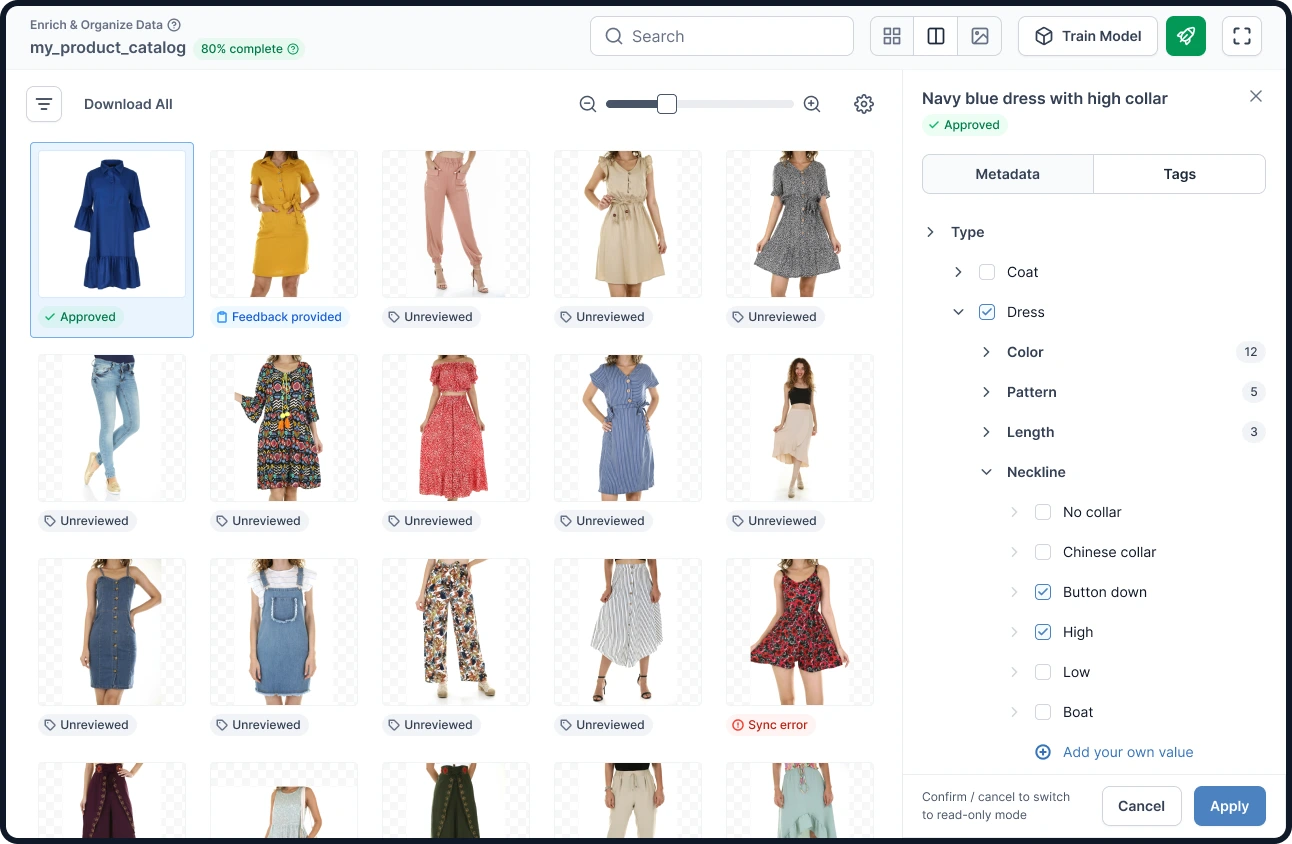
We used a hierarchical tree to handle large taxonomy structures when bulk editing. This was done so that the mental model of taxonomies remained the same across different modules. We iteratively brought in interactions to make the bulk editing more efficient.